In the ever-evolving world of software development, optimizing the performance of your applications is crucial. One tool that stands out for this purpose is Intel® VTune™ Profiler. But what exactly is VTune, and how can it help you write faster, more efficient code? This blog will guide you through the essentials of VTune and how to get started with this powerful performance analysis tool and be “perform first” mindeset.
What is Intel® VTune™ Profiler?
Intel® VTune™ Profiler is a performance analysis tool designed to help developers optimize their software by identifying performance bottlenecks in their applications. It provides a detailed breakdown of where your code spends the most time, making it easier to spot inefficiencies. With VTune, you can:
- Pinpoint performance issues in CPU and GPU usage
- Analyze threading and parallelism inefficiencies
- Optimize memory usage patterns
- Profile I/O operations and understand their impact on performance
Why Should You Use VTune?
For beginners and experienced developers alike, the benefits of VTune are significant:
- Understand Program Behavior: It helps you gain a deep understanding of how your code executes and interacts with hardware resources.
- Improve Application Performance: By identifying and fixing bottlenecks, you can significantly improve your application’s execution time.
- Optimize Hardware Utilization: It helps you ensure your code is making the best use of your system’s CPU and memory.
Whether you're developing for a high-performance computing environment, a server application, or a desktop program, VTune can provide valuable insights.
Getting Started with VTune: Installation and Setup
Before diving into VTune, make sure you have it installed on your system. Follow these
steps:
- Download VTune from the Intel® VTune™ Profiler website.
- Choose the appropriate version for your operating system (Windows or Linux).
- Follow the on-screen instructions to complete the installation process.
- Once installed, launch the application and explore the intuitive interface.
Running a Basic Performance Analysis
Let’s walk through a simple example to get started with VTune.
- Create or Open a Project:
- If you already have a project in mind, open it within VTune.
- Alternatively, create a new project and add your executable file.
- Choose an Analysis Type:
- VTune offers various analysis types, such as Hotspots, Threading, Memory Access, and GPU Compute.
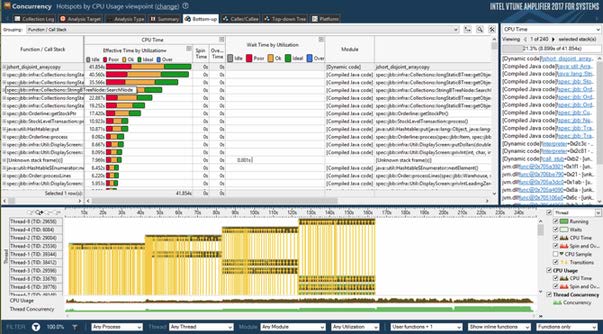
- For beginners, the Hotspots Analysis is a great starting point. It shows which functions consume the most CPU time, helping you focus on optimizing the parts of your code that matter most.
- Start the Analysis:
- Click the Start button to run the analysis.
- Let your application run as usual, and VTune will collect data in the background.
- Review the Results:
- Once the analysis is complete, VTune will present the results in an easy-to-read interface.
- The summary view will highlight the hottest functions—those that consume the most CPU time.
- Explore the Bottom-up and Top-down Tree views to understand where time is being spent.
- Optimize Your Code:
- After identifying performance bottlenecks, consider revising your code to optimize these hotspots.
- Rerun the analysis to verify if the changes have resulted in performance improvements.
Basic Analysis Types
VTune offers various analysis types depending on what aspect of your application you want to
investigate. Here are some of the primary analyses you can perform:
Hotspots Analysis:
- This analysis helps identify the “hot” sections of your code that consume the most CPU time.
- Use it to find functions that slow down your application and optimize them for better performance.
Threading Analysis:
- Designed to detect threading issues such as excessive synchronization or imbalanced workloads.
- Useful for multi-threaded applications where you want to ensure all cores are being utilized effectively.
Memory Access Analysis:
- Helps identify memory-bound issues like cache misses and excessive memory access latency.
- Perfect for applications that handle large datasets or perform intensive memory operations.
GPU Compute/Media Performance Analysis:
- For applications that use GPU resources, this analysis type can pinpoint inefficient GPU usage.
- It reveals bottlenecks in GPU compute tasks, making it ideal for media applications or GPU-accelerated workloads.

Understanding VTune Profiler Interface
The VTune interface is divided into several sections, making it easy to navigate and interpret your
data:
- Summary: A high-level overview of your application's performance, highlighting key metrics.
- Bottom-up View: Shows a detailed breakdown of CPU time and where it’s being spent in your code.
- Call Stack: Visualizes the call hierarchy, making it easier to trace performance issues back to the source.
- Timeline: Displays a time-based view of your application’s execution, showing how different threads and functions perform over time.
Common Performance Optimization Tips
When working with VTune, keep these tips in mind to get the most out of your profiling sessions:
- Start with High-Level Analysis: Begin with the Hotspots Analysis to get an overview of your code’s performance, then delve deeper into more specific analyses if needed.
- Optimize One Bottleneck at a Time: Focus on optimizing the most significant bottlenecks first before moving on to smaller ones.
- Use Inline Source View: It’s inline source view allows you to see metrics directly within your code, making it easier to correlate performance data with source lines.
- Profile in Different Scenarios: Run profiling sessions under different workloads or input scenarios to get a holistic view of performance.

Conclusion
Intel® VTune™ Profiler is an indispensable tool for developers seeking to elevate the performance of their applications. Whether you’re a beginner or a seasoned developer, it provides a structured approach to identify and resolve performance bottlenecks at different levels of your code, from high-level function profiling to low-level microarchitecture analysis.
By starting with a basic Hotspots Analysis, you can quickly pinpoint the most time-consuming sections of your code and get an overview of how your application interacts with the CPU. As you delve deeper, VTune’s comprehensive set of analysis types—including Threading, Memory Access, and Platform Analysis—offers the capability to identify nuanced performance issues such as inefficient memory access patterns, poorly synchronized threads, or underutilized GPU resources.
One of the biggest advantages of Vtune is its intuitive interface, which provides multiple views (e.g., Bottom-up, Top-down Tree, and Timeline) to present the performance data in a way that’s easy to understand, even for beginners. Additionally, the inline source code view allows you to map performance metrics directly to your source code, making it simpler to correlate performance insights with specific code segments.
VTune’s flexibility extends beyond basic profiling. With advanced features like Microarchitecture Exploration and Platform Analysis, you can gain insights that are typically only accessible to hardware experts. This level of detail empowers you to optimize code in ways that were previously challenging or impossible to achieve without in-depth hardware knowledge.
Ultimately, Intel® VTune™ Profiler doesn’t just show you where your code can be improved—it gives you actionable insights that help transform sluggish applications into high-performance software. The key is to embrace a performance-first mindset, continuously learn from it's data, and make iterative improvements. With time and practice, you’ll not only become proficient in usage, but also in writing highly optimized code that leverages your hardware’s full potential. For insights into optimizing performance analysis.
Whether you’re developing for desktop, mobile, or high-performance computing environments, VTune can be a game-changer in the way you approach software optimization. Take the first step today by downloading it, running a basic analysis on your project, and exploring the rich insights it provides. You’ll be surprised at how much hidden performance potential lies within your code, just waiting to be unleashed! For a comprehensive guide on getting started with VTune Profiler, check out Intel's official VTune Profiler Overview.

