
Introduction
In the age of the Internet of Things (IoT), real-time data collection and visualization have become essential for monitoring devices and making informed decisions. With thousands of sensors and devices generating continuous streams of data, organizations need a powerful tool to interpret and present this information effectively. Grafana emerges as a premier open-source visualization platform that enables interactive, real-time monitoring of IoT environments.
This article explores how it fits into an IoT ecosystem, its integration with various data sources, and best practices for deploying it successfully.
Why Grafana for IoT?
IoT systems generate an immense amount of data, often in the form of time-series metrics, which need to be visualized in an intuitive manner. It is well-suited for IoT applications due to its:
- Multi-Source Integration – Supports databases like InfluxDB, Prometheus, MySQL, and MQTT, commonly used in IoT.
- Real-Time Visualization – Enables live dashboards to track device performance, environmental conditions, and alerts.
- Customizable Dashboards – Provides an interactive, user-friendly interface to create meaningful visual representations of sensor data.
- Alerting and Notifications – Helps trigger automated alerts based on specific sensor thresholds.
- Scalability – Works with large-scale IoT deployments, handling thousands of devices simultaneously.
By leveraging Grafana, organizations can convert raw IoT data into insightful, actionable information.
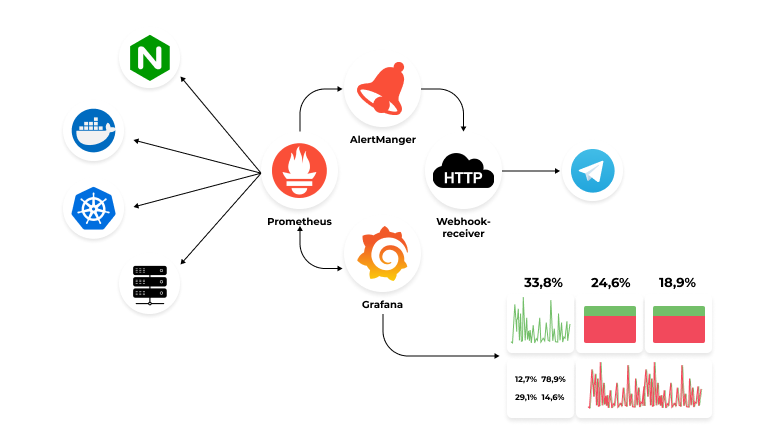
Grafana in an IoT Architecture
A typical IoT architecture consists of:
- IoT Devices and Sensors – Collecting data from the physical world (e.g., temperature, humidity, motion, energy usage).
- Data Transmission Layer – Using communication protocols like MQTT, HTTP, or CoAP to send data to central servers.
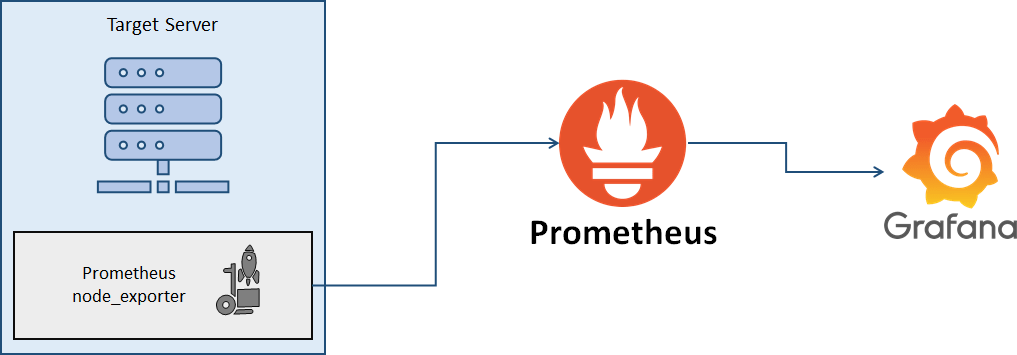
- Data Storage Layer – Storing collected data in time-series databases like InfluxDB or Prometheus.
- Visualization and Analytics Layer – Using it to interpret and visualize the stored data in dashboards.
Deploying Grafana for IoT Visualization
Step 1: Install Grafana
Grafana can be deployed in multiple ways, depending on the IoT infrastructure:
- Local installation on a server (Ubuntu, Debian, Windows, or macOS)
- Docker-based deployment for containerized environments
- Kubernetes-based deployment for large-scale cloud IoT applications
Example Docker Deployment:
docker run -d --name=grafana -p 3000:3000 grafana/grafana Step 2: Connect Grafana to an IoT Database
Depending on where the IoT data is stored, you can integrate it with:
- InfluxDB – Ideal for high-frequency time-series IoT data.
- Prometheus – Good for monitoring system-level metrics.
- PostgreSQL/MySQL – For structured IoT data analysis.
- MQTT – To fetch real-time messages from IoT devices.
Once installed, Grafana’s web interface (accessible via http://localhost:3000) allows users to configure these data sources effortlessly.
Step 3: Create IoT Dashboards
With data sources configured, the next step is to build interactive dashboards that display:
- Real-time sensor data (temperature, humidity, pressure, etc.)
- Device status and health monitoring
- Historical trends and analytics
- Anomaly detection and alerting
It allows users to customize dashboards with various visualization options like graphs, heatmaps, and tables.
Step 4: Implement Alerting and Automation
IoT systems often require automated responses to changes in sensor values. It’s alerting feature allows users to:
- Define threshold conditions (e.g., trigger an alert if temperature > 80°C).
- Send notifications via email, Slack, or other messaging platforms.
- Integrate with external automation systems for event-driven actions.
Challenges and Best Practices
While deploying Grafana for IoT is powerful, it comes with challenges:
- Managing Large Volumes of Data – IoT devices generate vast amounts of data. Using downsampling techniques in databases like InfluxDB can optimize performance.
- Securing IoT Dashboards – Implement authentication mechanisms (OAuth, LDAP) to restrict unauthorized access to dashboards.
- Optimizing Performance – Avoid excessive queries and use caching techniques to enhance it’s responsiveness.
- Ensuring Real-Time Updates – When dealing with MQTT or other real-time sources, enable WebSockets or short polling intervals for dynamic updates.
Conclusion
Grafana is a versatile and powerful tool for monitoring IoT environments, offering real-time visualization, multi-source data integration, and robust alerting capabilities. By strategically deploying it in an IoT architecture, organizations can transform raw device metrics into actionable insights, enhancing efficiency and operational awareness.
As IoT continues to expand, the role of Grafana in bridging data and decision-making will only grow. Whether you’re managing a small network of sensors or a large-scale industrial IoT deployment, it provides the tools needed to make sense of IoT data in a meaningful way. Learn more about Grafana here.