This project will guide you in setting up Prometheus to monitor a wide range of systemresource metrics, including CPU usage, memory consumption, disk I/O, network traffic,bandwidth usage, and packet loss. Additionally, it will walk you through configuring Grafanato visualize the data and create alert rules for conditions like high CPU utilization, memoryexhaustion, disk space shortages, high bandwidth usage, or packet loss, ensuringcomprehensive monitoring and timely notifications for critical system events.
Various usecases of Prometheus with Grafana include
- Infrastructure Monitoring: Track server metrics like CPU, memory, and disk usage using Node Exporter.
- IoT Device Monitoring: Visualize metrics from IoT devices, such as temperature and battery levels.
- Cloud Service Monitoring: Monitor resources and usage metrics from cloud providers like AWS or Azure.
- Network Monitoring: Analyze network traffic, packet loss, and bandwidth usage across devices.
- Alerting and Incident Management: Set up alerts for critical metrics and integrate with notification systems.
Prometheus
Prometheus is a real time time series Database built using http pull model.It is an opensource monitoring and alerting toolkit designed for reliability and scalability. It is widely used for monitoring applications, infrastructure, and services in cloud-native environments
Install Prometheus
wget https://github.com/prometheus/prometheus/releases/download/v2.41.0/prometheus-
2.41.0.linux-amd64.tar.gz
tar xvfz prometheus-2.41.0.linux-amd64.tar.gz
cd prometheus-2.41.0.linux-amd64
./prometheus --config.file=prometheus.yml
Install prometheus and set up the configuration (prometheus.yml)
- Run prometheus on localhost:/9090
Node-exporter
Node Exporter is a Prometheus exporter that exposes hardware and OS metrics from unix-based systems (Linux, BSD, etc.) to Prometheus. It's designed to help monitor the performance and resource utilization of servers, providing essential insights into system health.Install Node Exporter
Install Node-exporter

wget
https://github.com/prometheus/node_exporter/releases/download/v1.5.0/node_exporter
-1.5.0.linux-amd64.tar.gz
tar xvfz node_exporter-1.5.0.linux-amd64.tar.gz
cd node_exporter-1.5.0.linux-amd64
./node_exporter
Run localhost:/9100 to see the node -exporter metrics collected.
Set up the configuration (prometheus.yml) to scrape metrics from the Node Exporter (which will be installed later). Here's a basic configuration:
scrape_configs:
- job_name: 'node_exporter'
static_configs:
- targets: ['localhost:9100']
Now, restart Prometheus and then check the Service Discovery column of Prometheus to find node-exporter in it as shown below.
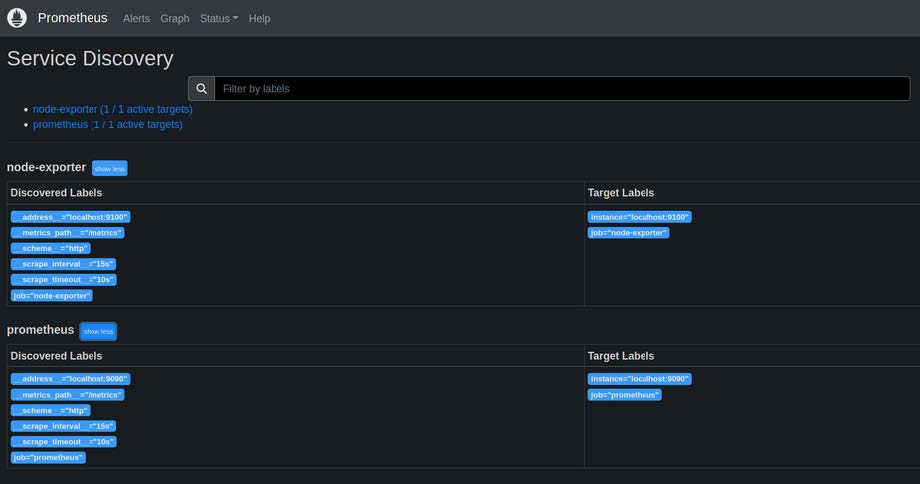
Then Run the query "up" to check the status of the job:node-exporter on port 9100. Then,You can view the collected metrics by running queries in the Prometheus query column.
Eg: On running query node_memory_MemTotal_bytes
we get ,
{instance="localhost:9100", job="node-exporter"}
16498139136 as shown below

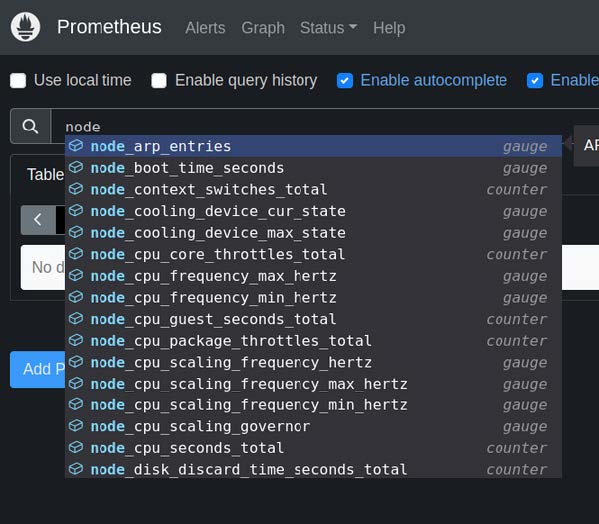
Set up New rules
We can create recording rules for Node Exporter metrics in Prometheus. This allows you to store computed values that can be reused in other queries, making your monitoring setup more efficient and organized.
Create a YAML file for your recording rules, typically named custom_rules.yml. If you
already have one, open it for editing.
Step 2: Define Your Recording Rules
In your custom_rules.yml file, you can define your recording rules for Node Exporter metrics. Here is an example for Memory Usage in Percentage.
custom_rules.yml:

Make sure to reference your rules file in the Prometheus configuration
(prometheus.yml). Add or update the rule_files section:
rule_files:
- "custom_rules.yml"
Then ,
Open the Prometheus web UI (default at http://localhost:9090).
Go to the Rules tab to check the status of your recording rules and ensure they are
evaluated correctly.

Set up Alert Rules Using AlertManager
Alertmanager is a crucial component of the Prometheus monitoring ecosystem that handles alerts generated by Prometheus servers. It is responsible for managing and routing alerts, allowing you to effectively respond to critical issues in your system.
Install AlertManager

wget
https://github.com/prometheus/alertmanager/releases/latest/download/alertmanager-
<version>.linux-amd64.tar.gz
tar -xvf alertmanager-<version>.linux-amd64.tar.gz
cd alertmanager-<version>.linux-amd64
Run the alertmanager servive on localhost:9093

Open the Prometheus configuration file (prometheus.yml) and configure alert rules:
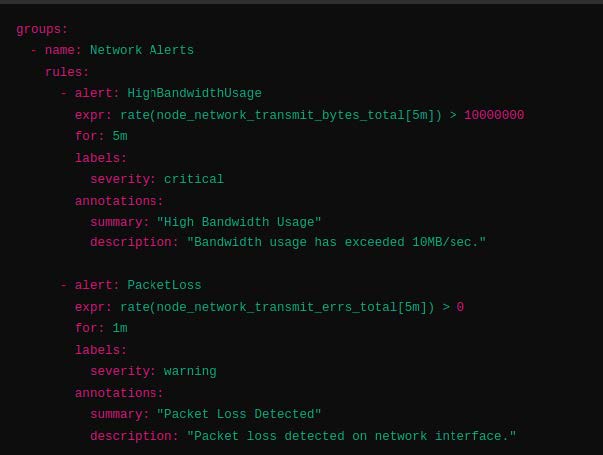
Edit your prometheus.yml file to include the alert rules file you just created. Add or modify the
rule_files section like this:
In prometheus.yml , add
rule_files:
- "alert_rules.yml"
Reload Prometheus configuration using the following command
curl -X POST http://localhost:9090/-/reload.
Then, check the rules page of Prometheus to see the alert rules set.
GRAFANA
Grafana is a powerful open-source platform for monitoring and observability, often used to visualize metrics, logs, and application data. It supports a variety of data sources and allows you to create dynamic dashboards with graphs, charts, and alerts.
Install Grafana

sudo apt-get install -y adduser libfontconfig1
wget https://dl.grafana.com/oss/release/grafana_9.3.6_amd64.deb
sudo dpkg -i grafana_9.3.6_amd64.deb
sudo systemctl start grafana-server
sudo systemctl enable grafana-server
Open Grafana in your browser at http://localhost:3000 and log in with default
credentials (admin/admin).
- In Grafana, go to Configuration > Data Sources and add a new data source.
- Select Prometheus and enter the URL: http://localhost:9090.
- Click Save & Test to make sure it's working.
That is all the node-exporter metrics are viewed as shown below
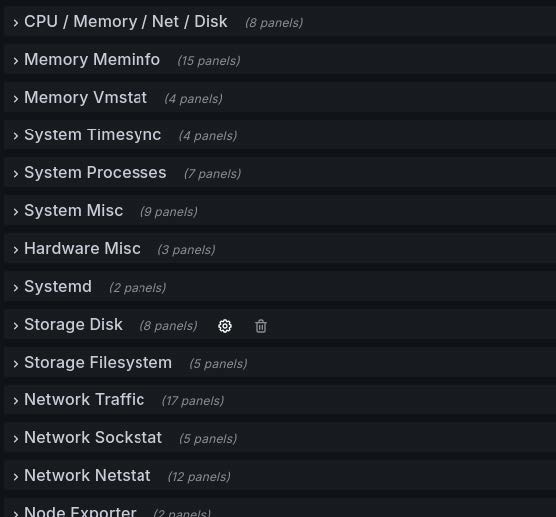
Grafana Dashboard View
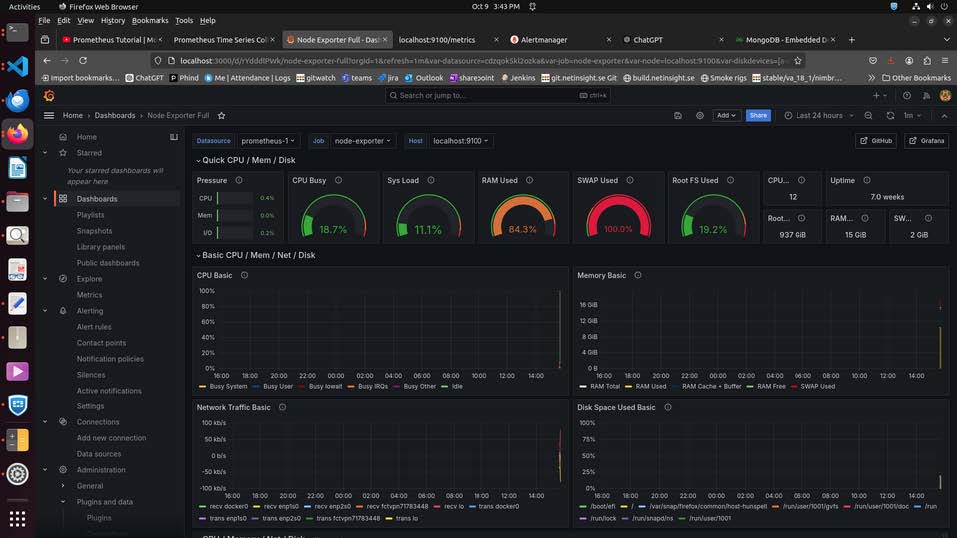


Grafana monitoring dashboard displays a comprehensive set of panels for systemmetrics. The dashboard includes various categories, such as CPU, Memory, Network,and Disk, allowing users to monitor system performance in real-time. Each categoryfeatures multiple panels dedicated to specific metrics, such as memory usage (MemoryMeminfo), system performance (System Timesync, System Processes), and networkstatistics (Network Traffic, Network Netstat). This detailed view empowers users toanalyze system health, troubleshoot issues, and optimize resource utilizationeffectively.
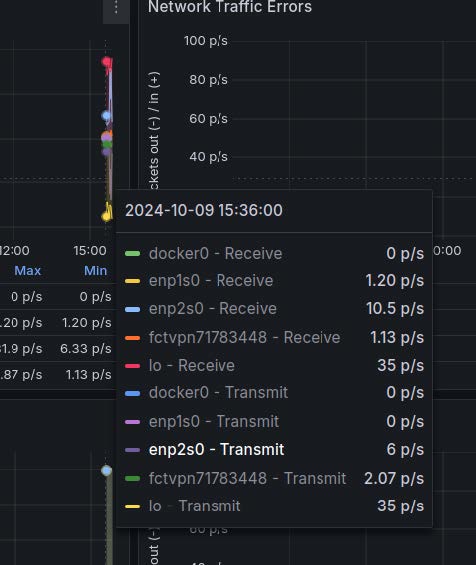
The below image shows the network traffic packets received and transmitted time totime
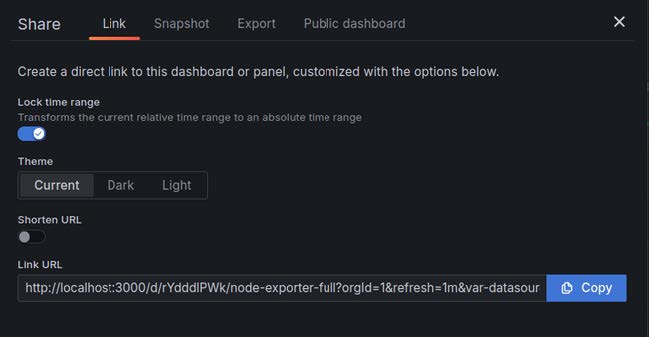
Share Grafana Dashboard
In Grafana, the Share options allow users to easily share dashboards, panels, or specific visualizations with others. Here’s a brief overview of the different share options available in Grafana:
- Dashboard Share
link: You can generate a link to the entire dashboard that others can access. This link can be shared directly with team members or users.
snapshot: Create a snapshot of the dashboard, capturing its current state. This snapshot can be shared as a static view, allowing users to see the dashboard's data at a specific point in time.
embed: Get an embed code (HTML iframe) to include the dashboard in other web applications or websites.
- Panel Share
link: Similar to the dashboard share option, you can generate a direct link to a specific panel. This is useful for highlighting particular metrics or visualizations. Embed: Like the dashboard, you can get an embed code to share the individual panel elsewhere.
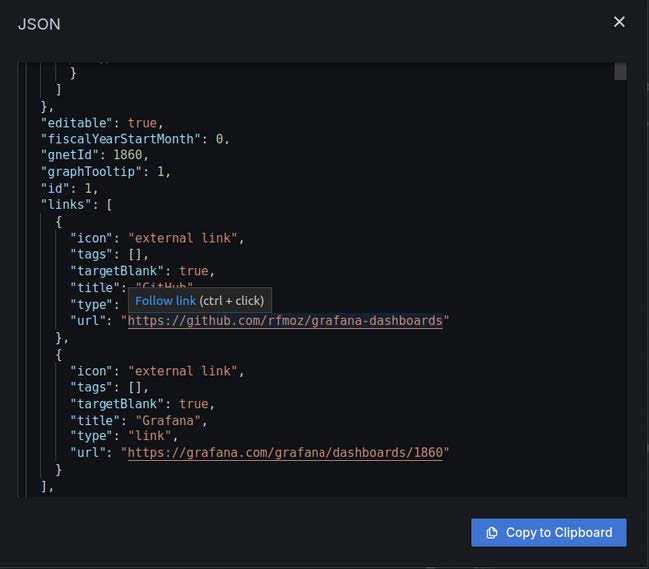
- Export
Export Dashboard: Download the entire dashboard as a JSON file, which can be imported into another Grafana instance. This is useful for backup or sharing configurations.
- Permissions
Control Access: You can set permissions for who can view or edit the dashboard. This ensures sensitive data is only accessible to authorized users.
Conclusion
By utilizing Prometheus for data collection and Grafana for visualization, organizations can gain valuable insights into their network behavior. The ability to create custom alerts further enhances monitoring capabilities, allowing for proactive issue resolution. Implementing these solutions empowers teams to make informed decisions and optimize resource allocation. Overall, this approach fosters a culture of continuous improvement and enhances IT infrastructure reliability.

